Riverrun and Colourwall: Kevin McCourt (Artist) and Bartolo Luque (Theoretical Physicist). See: www.kmccourt.org & http://www.dmae.upm.es/bartolo.html
The name Riverrun refers to the “first” word in the circular work Finnegans Wake by James Joyce. Colourwall is a playful reworking of the title for Ellsworth Kelly’s 1951 painting, Colors for a Large Wall.
Riverrun and Colourwall: Concept and Working Outline.
The online digital versions of Riverrun and Colourwall could be described as emergent “exquisite corpses”. They can be considered radical re-workings of this technique first used by the Surrealists, not only because of their use of technology but also for their focus on networks and collective creativity, rather than linear process. Crucially, it is also an interdisciplinary art and science project. The central research question behind the practice could be described as follows: “Will collective intelligence emerge (scientific analysis) and if so what are the aesthetic implications (art theory)?”
Both are based on the process and result of social interaction, within and across neighbourhoods, involving more than 100 makers who work together in the production of stories and images in real time. Each participant, using his own computer (client) to connect to the project for the duration of the event, writes, draws or paints (in the future this may include importing small (mobile) films or other objects) a small part of the work which is housed in a central computer (server). These creative experiments can be performed in different languages, and within and across varied geographical and cultural contexts. Each story or image will be projected in a physical, rather than virtual, exhibition space, as it evolves and in real time. The whole creative process will be recorded step by step on the server, allowing for each experiment to be freely distributed as video and re-presented in future exhibitions or conferences. The final stories and images will be made available online to the general public after each event.
The evolution of each work, incorporating the individual creative decisions made, will be codified as sound. The combined audiovisual project will be presented as an immersive installation as part of the exhibition mentioned above.
Riverrun: How does it work? http://riverrun.heroku.com
Let’s suppose that the creative community consists of 100 writers on their respective computers (clients). Each will write one line of the 100 which make up the story. The server randomly assigns a line number, from 1 to 100, to each participant. The writers do not know this number, that is to say, the position of their line in the story as a whole.
For each experiment, we set a radius of visibility; the number of lines above and below their own which they can see in the story. If the radius is, for example, R=1, and the writer 46, this writer will see, in real time, thanks to the server, how neighbouring writers are changing lines 45 and 47. Before beginning each experiment, we will ask each writer to seek “narrative coherence” (whatever that may mean) with neighbours’ contributions. To this end, they will be able to change their sentence, if they feel it necessary and whenever they wish, in order to adapt it to their neighbours’ modifications.
Extract from an experiment (Spanish)
If the radius is 0, there will be no interaction or coherence since each contribution will be totally independent. If the radius is the maximum possible, all the writers can see the whole story; their line and 99 others changing continuously. We believe this excess of information would prevent the writers from changing their own line in an adequate way, and the text would never crystallize or come to any final form. We expect there exists a critical value for the radius of visibility, relative to the number of writers, which may produce more interesting stories, from a creative perspective.
The first and last lines are especially relevant. If a writer doesn’t see sentences above his/her own, it is obvious that he/she is writing in position number 1, the first line of the story. Conversely, if there are no sentences below, the writer knows that his/her line is the last, number 100. This information would strongly prompt these participants to write a beginning and ending respectively, despite “pressure” from their neighbours to do otherwise. However, we can also change these boundary conditions by making them periodic i.e. if we join the beginning and the end together. In such experiments, number 100 will see 1, 2, etc. below, and number 1 will see 100, 99 etc. above. Consequently, no writers will be aware of their position in the text. Will a circular story emerge, with no beginning or end, or will certain writers insist on writing a beginning or ending for the story?
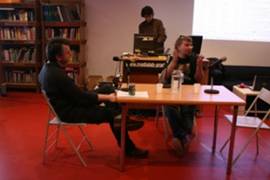
Image: Electrosmog Festival of Sustainable Immobility. (Test and online debate Medialab-Prado, Madrid).
Colourwall: How does it work?
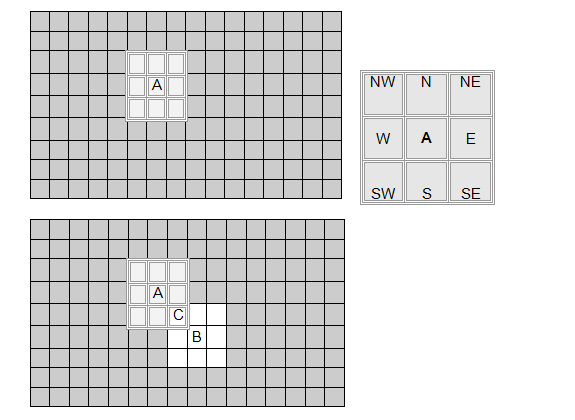
Imagine there are 144 creators collaborating online. (We would expect a greater number of participants in a real experiment). They collectively paint or draw an image, which we can think of as a grid. (In reality, the shape of the grid and the way in which its individual cells fit together may well be very different and much more flexible). In this grid, there are 16 x 9= 144 squares or cells. Each creator paints or draws in only one of these, which is randomly assigned by the server. Each participant sees, in real time, what is being painted or drawn in the eight surrounding cells (in the diagram we can see participant A in the centre of these 8 immediate neighbours) and decides how best to change his/her cell in order to achieve “aesthetic coherence” (again, whatever that may mean) with these neighbours.
Given that the influence is local (each individual is influenced only by his immediate neighbours and not by the whole grid) we would not expect to see the emergence of global coherence. However, in reality influence can extend itself over a longer range. If we look again at the diagram above, we can see how B influences A, in spite of them not being immediate neighbours, through intermediary C.
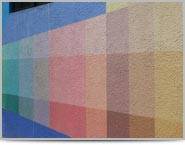
Image: Colourwall (graphic visualisation).


